Today the Lincolnshire Road Safety Partnership (LRSP) tweeted a link to a survey. These sort of things are usually fertile hunting ground for some desk-headbuttingly bad content, so naturally I went and had a look. Let’s take a walk through it.
The basic premise
Page 1 describes why the survey has been created: to gather “assistance in understanding road the safety issues which affect you”.

This is how we roll
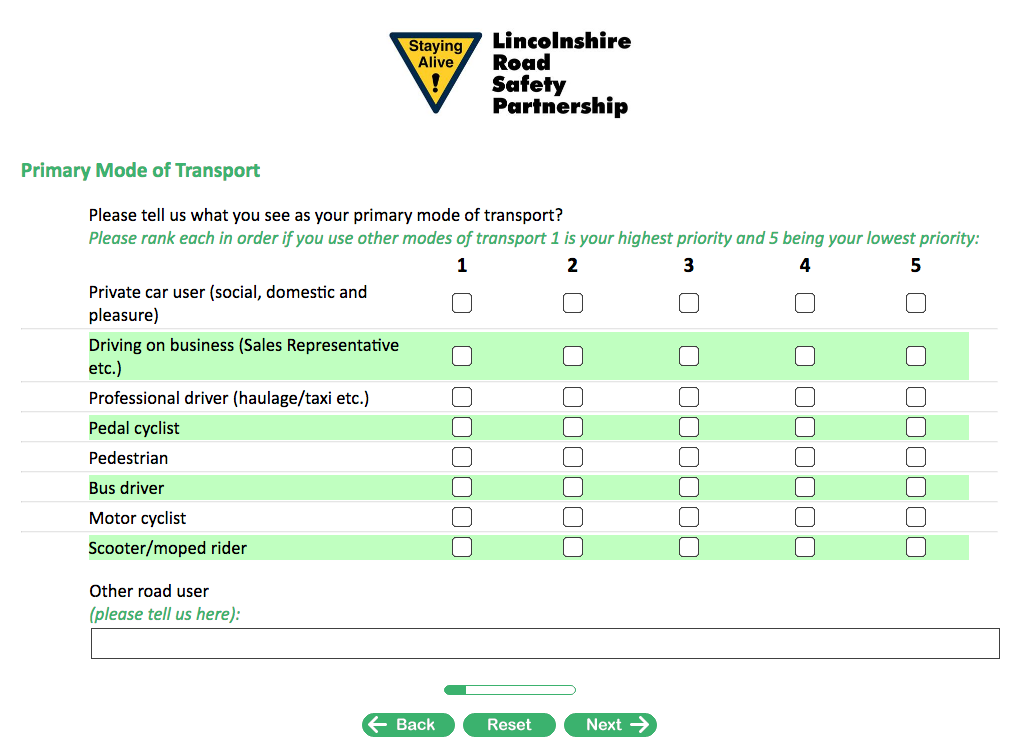
Page 2 asks “what you see as your primary mode of transport”. Actually, it asks for all your modes of transport. It looks like it assumes you use no more than five since it asks you to rank them, but you can assign the same ranking to any number of things. Some are not modes of transport but user roles within a mode. It’s all a little haphazard. Not a great start in terms of gathering good-quality data.
Leisure or utility?
On to page 3, which is rather confusing. It’s titled “primary mode of transport” and asks questions about leisure use. If you said your primary mode was driving (as will be the case for most people) it’s no longer clear whether this is about the primary mode or another mode. But since this page asks about mode, and driving is omitted, the user is forced to assume the latter: this is not about the primary mode. Probably.
Also, there’s lazy use of terminology here: technically, the pavement is part of a road, but most people who run on the pavement probably wouldn’t say that they use “the road” for running. Is LRSP referring to the road as a whole, or just to the carriageway? It’s hard to know.

Page 4 dips further into leisure use. It’s a truly baffling page, because it asks for “the main reason for your journey”—which, for leisure use is probably, er, leisure. You can choose the school run as your leisure pursuit, but not leisure.
It’s also notable that there’s no way of saying that you walk or cycle for both leisure and utility. Perhaps LRSP would become a little confused if there are too many pigeon-holes to put people into.
Again, the title is about the primary mode. But by now I guess we’re pretty clear on that being an error: it’s explicitly about leisure pursuits, right? Or, since the “reason for your journey” can’t be leisure, maybe it is your primary mode. I’ve no idea. Answers on a postcard, please.

Page 5, again supposedly about your primary transport mode, asks your annual mileage and the environment in which you do most of your driving. Yes, your driving: it asks you this even if you said earlier in the survey that your primary mode was something different, and indeed it asks you this even if you said you don’t drive. Should you leave this empty because you don’t drive, or fill it in according to your primary mode? Who knows—LRSP clearly aren’t fussed.

Safety: it’s a “you” thing
Page 6 asks how you feel about your safety. But… for which mode? I mean, I feel “very safe” when I’m in a car but not when I’m cycling. LRSP really don’t want to take a nuanced view on road use: safety is a homogeneous thing to them.
Note the use of the word “safe”: “do you feel safe”, not “how at risk do you feel” or “how endangered do you feel”. It’s a subtle thing, but the difference is significant and illuminating. More on that in a forthcoming article, which also happens to involve LRSP.

Page 7 talks about the danger posed by others (though still frames it as safety). Again, it’s totally devoid of any differentiation of modes, or indeed highway environments.
One option on this page stands out: “not wearing seatbelts”. This is a question about others’ behaviour affecting my safety. This one doesn’t fit at all, and its inclusion is telling: it looks like this is simply a list of the well-worn list of things that the road safety industry considers legitimate targets. It’s their current to-do list crudely shoved underneath a question that doesn’t accurately relate to it, and no-one seems to have been bothered by that. There is a lack of care here, an indifference to anything more than the vindication of the status quo.

Outgroups
Page 8 is quite worrying and even makes me question the legality of the survey, because it’s clearly discriminatory. The user is prompted to express their concern about two types of drivers: to be blunt, boy racers and old duffers. The bulk of the driving population, aged 24-60, is omitted.
Bizarrely, there are three rows for motorcycles. Is LRSP genuinely expecting people to say that they have three varying levels of concern about motorbikes depending on the engine capacity? It’s ludicrous. There’s no differentiation between cars, buses, HGVs and so on despite the different risks they present (again, obviously also no way to relate you concern about certain vehicles or drivers specifically to the various modes of transport that you use) but you’re expected to check the displacement of a motorcycle engine and provide a nuanced concern based on that.
Note also that the priority ordering has now been reversed compared to earlier pages, which is going to confuse a few people. Emojis have also appeared, but their meaning is a total mystery: does a smiley face mean you’re happy with this group? If so, it’s contrary to the message in the text. It’s utterly confusing. The problem is that basic usability errors lead to poor data.
The page title is “vulnerable road users”. Any potential connection between this and the question is totally unfathomable.

We don’t know what works
Page 9 is yet another serving-up of the status quo for approval. Top of the list is “cycling safety” and if you require any explanation as to why that is depressing then you haven’t been reading this blog enough. I suppose they’ve at least omitted explicit pedestrian training.
But still, this page is—as with several before it—really just an opportunity to have members of the public say that someone else should be trained.
Moreover, why is there a need to ask the public? The answer is presumably that LRSP have no interest in actually evaluating what works. You or I might think the priority areas might be the ones which show the greatest effect in reducing risks to third parties. But that’s risk reduction; that’s not how “road safety” works. This is about pursuing populist, opinion-driven policy to give the impression of something being done, not about reducing danger on the roads.

Page 10 asks for ideas. The second question, asking whether the user “is a road user type” (you don’t use a mode of transport, you are a mode of transport) seems slightly curious. Surely it can’t be difficult to determine the unlisted modes of transport used in the UK—mobility scooters, for instance—without having to ask the public? What do I know…

Who gets it?
Page 11 asks who LRSP should be aiming their education firehose at. (Well, actually it’s “information and support”, which are two massively different things required by totally different sets of people in any given context, but that’s clearly too nuanced for LRSP. You could give information to bereaved relatives of a dead pedestrian and support the driver who hit them in their return to driving… it’d be quite valid within the context of this question, but it might not be the best response.)
The choices? Children, young adults, the elderly, or the disabled. Maybe just a bit discriminatory again? No prompt to suggest that,, let’s say, people—whatever their age or physical and mental ability—doing the school run might pose specific risks which need specific targeting, or that professional drivers—whatever their age or physical and mental ability—might be working to conditions that present specific risks.
Again, this really seems an opportunity for the bulk of the population to demand that someone else be bothered. Leave the 24-60s alone, go and tell grandad on his mobility scooter to watch out for cars.

Page 12 again essentially indicates that LRSP haven’t bothered measuring the success of their work. “What do you think is effective?” it asks—well, hey, why don’t you set some key performance indicators and implement a means of measuring them, rather than conforming to the road safety industry standard of making some films and posters and hoping they cause people to just stop driving into things?
It seems optimistic that this will even produce a useful representation of opinion: people filling in the survey are a self-selecting set. They’re primarily the people who already pay attention to road safety organisations and engage with them. Which means the chances are that they’re the people who are generally more interested in road safety. What you really want to know is how to influence the people who couldn’t care less about road safety.
But still, you’ve knocked together an online survey and you’ve got some responses. That counts as research, right? Sure. It’s the sort of “research” that six year olds do (albeit with paper and coloured pencils rather than the Internet—but at least they have to ask the whole class rather than just the kids who volunteer an opinion).
Note the title: this page is about the “best methods of promoting road safety”. Promoting safety is a whole world away from reducing danger. It’s transference of responsibility; it’s hope; it’s a misunderstanding of human behaviour; fundamentally, it’s inaction.

Page 13 also asks the user to provide an opinion where LRSP should be getting the answer from research.

Are you naughty?
Pages 14 and 15 are a sort of self-reporting mechanism relating to mobile phone and seatbelt offences, with some questions about them. Nothing too dismal per se, but notably it doesn’t ask whether you have been or know anyone who has been a victim of someone else’s phone use, and more notably still it returns to an earlier point: that the user is only really being asked about the things that road safety partnerships find easy.
If this section was expanded into other areas and done a bit better, omitting most of the earlier content, it could form the basis of a broadly useful set of data. But as it stands it doesn’t seem terribly helpful.

Page 15 adds a copy-and-paste error, again asking about phone use, which again serves to illustrate the diligence with which LRSP have approached this survey.

The final page of the main questions, page 16 is—well, just a little weird.

Well, you wanted opinion…
So, overall we have an absolutely typical survey: confusingly presented, haphazardly constructed, with an over-emphasis on opinion rather than evidence and no sign of any ability to gather responses in a way that provides good data for evidence-based policymaking. The arguable age and ability discrimination is the icing on the cake.
This stuff influences policy in Lincolnshire. People’s opinions about other road users and what should be foisted upon them. Prejudice where there should be data; perceptions where there should be analysis; populism where there should be almost anything but.
The invited responses which list the extremes of the age range, and which obsess on two-wheelers while ignoring four-wheelers, belie the inevitability of the process: this is about the majority pushing blame and responsibility to the minority, regardless of who actually poses the greatest danger to others, and the survey is simply one small piece of the machinery which accordingly perpetuates the status quo.
As a small aside—and this is just one view onto one issue among a whole pile of different datasets that can be used to analyse road danger—here’s a graph from the forthcoming article that I mentioned earlier. It shows Lincolnshire’s performance in terms of cycling casualties in collisions involving at least one motor vehicle.
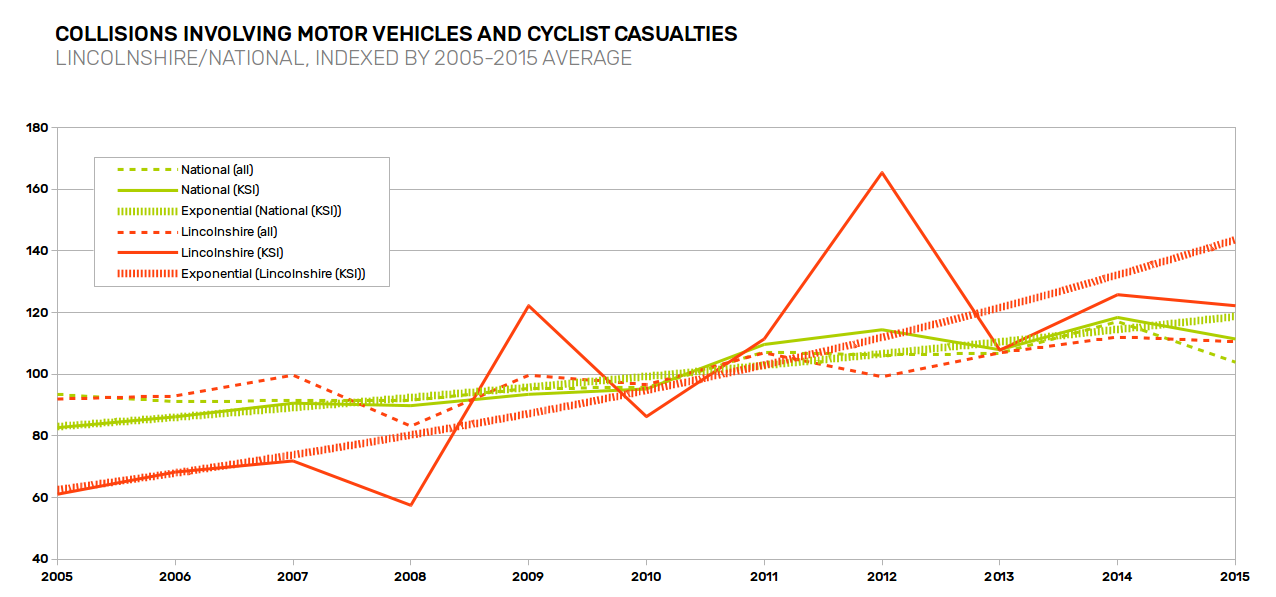
It shows that although the number of reported collisions (which, broadly speaking, correlates with the “all casualties” dashed lines) has been rising roughly in line with the national average, the rate of fatal and serious injuries has been rising much more quickly. And it’s worth noting that in some measures of cycling levels, several of the local authorities showing the greatest decline are in Lincolnshire: casualties in motor vehicle vs pedal cycle collisions are both rising in both number and severity while the amount of cycling going on would appear to be going down. Which doesn’t exactly reflect well on whatever Lincolnshire is doing.
I am somewhat sceptical that the results of LRSP’s survey will provide any insight as to how to address problems such as these.
Wow, that is one appalling survey. I am particularly struck by the fact that if you say you are very concerned about, let’s say, boy racers or people using their phones, you earn a smiley face.
For Page 8 you write “Note also that the priority ordering has now been reversed compared to earlier pages. Basic usability errors lead to poor data.” I think this is still being generous. Not only is it dissimilar to the previous pages, the page itself is unclear – it says that 1 has the lowest priority, 5 the highest. I assume that means that one gives 5 to the group one is most worried about. But the smilies with the numbers tell the opposite story – surely I put a sad face with the ones I am most worried about, and a happy one with the ones I am least worried about. Also, am I supposed to give those I don’t worry about score 1 or 5, or not score them at all. This isn’t just confusing design, this is design bad enough to make the whole thing meaningless. And indeed, why 2 age groups of drivers and not worry about the rest?
Re:graph
You seem to have ‘KSI’ collisions sometimes exceeding ‘All’ collisions!
Might there be a 10x factor in the scaling on the vertical axis ?
“If you were referred to an educational training course, a Speed Workshop for example, would you attend ?”
It is unfair not to say that the alternative to the course would be to admit to being guilty of a criminal offence, subject to a FPN, fine, points, endorsement, criminal record etc !
Or are they not asking about
https://ndors.org.uk
“’not wearing seatbelts’. This is a question about others’ behaviour affecting my safety.”
Maybe ‘risk compensation’ means people wearing seatbelts drive MORE dangerously?
It’s included here as one of the ‘Fatal Four’ (or Five).
The confusion here is ‘obeying the law’ vs ‘safety’.
See also this muddled article: (from Cornwall)
https://dcarvsgt.wordpress.com/2015/07/28/seat-belts-any-of-my-business/
He mis-uses the “6-inch spike” not to say ‘drive safely’, but to say ‘wear your seatbelt instead (so you can keep driving dangerously)’!
To some extent he is trolling – being deliberately provocative as clickbait, pushing the bounds of acceptability, for popularity in policetwitterawards.com !
http://9gag.com/gag/65357/new-seatbelt-design
“Are there courses you would like to see us develop?”
Needs to say which courses are already available …
https://www.lincolnshire.gov.uk/lincolnshire-road-safety-partnership/driver-training-and-courses
cf
https://ndors.org.uk/courses/
?
“Are you a road user type that we do not interact with?”
Cross-country Skier?
Hedgehog?
http://thelincolnite.co.uk/2016/02/stark-warning-after-dramatic-rise-in-lincolnshire-road-deaths/
“‘Young Drivers’ category … are a vulnerable group” – odd use of ‘vulnerable’!
It’s also odd that “North Lincolnshire Road Safety Partnership” exists as well!
http://www.northlincs.gov.uk/EasySiteWeb/GatewayLink.aspx?alId=29154
http://www.northlincs.gov.uk/your-council/about-your-council/news/archived-news-stories/lowest-ever-road-casualty-figures-recorded-in-north-lincolnshire/
… and NE Lincs
https://www.nelincs.gov.uk/roads-parking-transport/traffic-and-road-safety/road-safety-advice/
… both of which also seem to be part of saferroadshumber.com !
It may be relevant that many of these ‘Road Safety Partnerships’ started out as ‘Safety Camera Partnerships’ from turn-of-the-century schemes where penalty revenue was ‘hypothecated’ back into road safety measures.
They’re separate administrative areas. They’re quite different to Lincolnshire. Again, there may be rather more on that in due course…
Two points:
As a “rep” covering over 30k miles per year over the whole of the U.K. Mainly on motorways and A roads, I find the worst roads to drive on after Cornwall and Cumbria are in Lincolnshire. My main moan is agricultural vehicles holding up lots of vehicles by driving slowly and not pulling in to let vehicles past when they have a chance.
Another moan which doesn’t happen in Lincolnshire due to lack of dual carriageways is lorries acting as a rolling roadblock by one trying to overtake another with a speed differential of about 1 mph leading to taking 2 miles to overtake.
As for wearing seat belts, I always wear mine and insist my passengers do, I couldn’t care less if other drivers choose not to wear their seat belts, If they don’t wear their seat belts and get killed or injured, that’s their choice.
Unfortunately and just like Safer Roads Humber, or whatever name now used, this is nothing to do with road safety and all about obtaining justification for the use of “Road Safety Camera Vans” by Lincolnshire and there is no real interest in actual road safety. This is the organisation that had to remove one of it’s safety awareness notices because to was so badly placed, at a 90 degree right hand bend on the A15, that drivers reading it were missing the corner and going off the road. Like other area’s, Lincolnshire is moving towards driver education rather than fines and points as the revenue from the driver education courses go into their coffers whilst the fines go to the Treasury so are more interested in reactive rather than pro-active actions. A useless survey for a useless organisation.
A nice piece of detailed deconstruction